Google Analytics heat map tools shine a light on your website’s performance. They make the complex simple.
With these tools, you can see how visitors use your site. It’s like having a map of user behavior. This map guides you to make your website better.
Whether you’re a marketing pro or just starting, heat maps are your ultimate tool. They turn data into colors. These colors show what works and what doesn’t on your website.
Simple, right? Let’s throw more light on this. Let’s make your website the best it can be, together.
What are Google Analytics Heat Maps?

At its core, a Google Analytics heat map is a visual representation of data where values are depicted by color. They allow website owners to quickly identify which areas of their site are garnering the most attention and engagement.
This tool translates complex datasets into a colorful map of user activity, highlighting patterns that might otherwise go unnoticed.
Also, heat maps are instrumental in revealing user behavior patterns, such as where visitors click, how far they scroll, and where their mouse hovers.
This information is invaluable for understanding how effectively your content captures attention and guides the user journey.
Key Benefits of Using Google Analytics Heat Maps
Leveraging Google Analytics heat maps offers numerous advantages, from enhancing user experience to boosting conversion rates. Here are some key benefits:
Improved Website Usability
Heat maps provide direct insights into user interaction. They allow webmasters to refine their site layout, navigation, and content placement for better usability.
Optimized Content Placement
By understanding where users are most engaged, you can strategically place key content and calls to action to increase visibility and interaction.
Decreased Bounce Rates
Insights from heat maps can help identify and rectify areas causing confusion or disinterest, thus reducing bounce rates.
Enhanced Conversion Rates
With data-driven adjustments to your website based on heat map analysis, you can guide users more effectively toward conversion points.
How to Access Heat Maps in Google Analytics
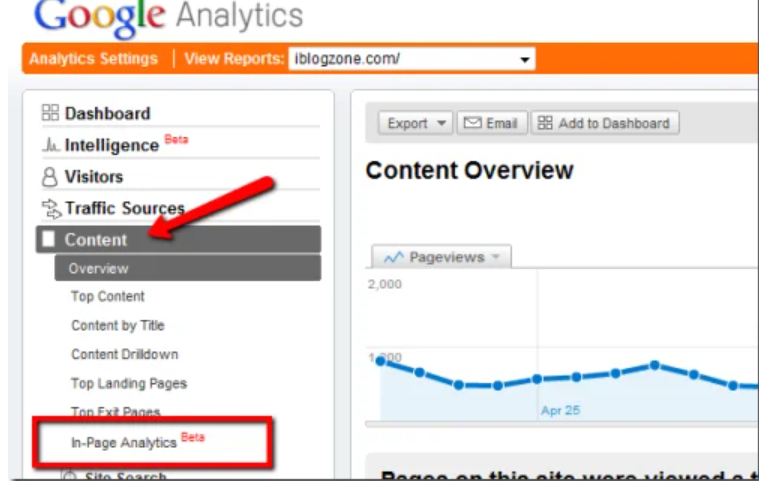
Accessing Google Analytics heat maps requires integrating with third-party tools or using Google’s Page Analytics Chrome extension. To maximize the effectiveness of heat maps, follow these steps:
Choose a Heat Map Tool
Select a tool that integrates well with Google Analytics. Tools like Hotjar or Crazy Egg are popular choices that offer detailed heat map functionalities.
Set Up Tracking
Implement the tracking code provided by your chosen tool on your website. This usually involves adding a snippet of JavaScript to your site’s header.
Analyze Your Data
Once the code is active, your chosen tool will start capturing user interactions. Log in to your tool’s dashboard to view the heat maps and gain insights into how visitors engage with your site.
By following these steps, you can easily access detailed heat maps. This offers a colorful and intuitive way to understand user behavior and improve your website’s performance.
Interpreting Data from Google Analytics Heat Maps
Interpreting heat map data effectively can unlock a wealth of insights about your website’s performance and user preferences:
Click Maps
Show where users click on your site, highlighting areas of high engagement and potential areas of confusion.
Scroll Maps
Indicate how far down users scroll on your pages, helping you understand if key content is being seen.
Move Maps
Track where users move their mouse on the page, which can be indicative of reading patterns and interest areas.
By analyzing these different types of heat maps, you can conclude user behavior, preferences, and potential barriers on your site.
Improving Website Usability with Heat Map Insights
Heat map data can be transformative in enhancing the user experience on your website. Here’s how:
Navigation Optimization:
Heat maps often reveal how users navigate your site. Use this data to streamline your menu and link placement, ensuring visitors can easily find what they’re looking for.
Content Optimization:
Identify which sections of your pages receive the most attention and place key messages or calls to action in these hotspots.
Layout Adjustments:
If heat maps show that essential content is being overlooked, consider redesigning your page layout to make information more accessible.
Implementing changes based on heat map analysis can lead to a more intuitive and user-friendly website. This encourages extensive visits and more interactions.
Integrating Google Analytics Heat Maps with Other Analytical Tools
While Google Analytics provides a broad overview of website performance, integrating heat map data with other analytical tools can offer a more nuanced understanding of user behavior. Here’s how:
Combining with A/B Testing
Use heat map insights to inform A/B tests, comparing how different page versions perform regarding user engagement and conversion.
Session Recordings
Pairing heat maps with session recording tools can help contextualize user actions. They provide a clearer picture of the user experience.
Funnel Analysis
Integrating heat map data with conversion funnel analysis helps identify where users drop off and how page design influences their journey.
This approach to analytics enables a deeper dive into user interactions. As a result, they facilitate data-driven decisions that can significantly impact website performance.
Best Practices for Google Analytics Heat Maps
To maximize the benefits of using Google Analytics heat maps, follow these best practices:
Regular Review
User behavior evolves, so regularly review heat map data to keep your website aligned with user preferences.
Segment Data
Analyze heat maps for different user segments (e.g., new vs. returning visitors) to tailor the experience to their specific needs.
Focus on Objectives
Prioritize changes based on your website’s key objectives. If conversion is your goal, concentrate on optimizing paths to conversion points.
Additionally, avoid common pitfalls, such as over-reliance on a single heat map type or making hasty design changes without testing. This will help ensure your analysis leads to meaningful improvements.
Leveraging Heat Map Data for Business Growth
Google Analytics heat maps are your secret weapon for business growth. They offer a clear, colorful snapshot of how users interact with your site.
This isn’t just data—it’s a guide to making your website work harder.
See where users click and where they don’t. Use this to showcase your best content or rethink underperforming areas. It’s about making every part of your website engaging and effective.
But it’s more than just tweaking designs. It’s about understanding what your users want and giving it to them. This leads to a better user experience, more conversions, and a thriving business.
Think of heat maps as a dialogue with your visitors. They tell you what works and what doesn’t. Listen closely, and you’ll find the keys to growth.
With Google Analytics heat maps, you’re not just running a website. You’re growing a business.
Harnessing Google Analytics Heat Maps
Google Analytics heat maps offer a powerful lens to view and understand user interactions on your website.
By leveraging these insights to inform design and content strategies, businesses can significantly enhance the user experience, leading to higher engagement, conversion rates, and ultimately, business growth.
Remember, the digital landscape is ever-evolving, and so are user expectations. Continuous monitoring, analysis, and adaptation are critical to staying ahead.
If you’re looking to harness the full potential of Google Analytics heat maps but need expert guidance, don’t hesitate to contact Flying V Group.
Our team specializes in leveraging data-driven insights to fuel business growth and enhance digital marketing strategies. Let us help you transform your website into a user-friendly, conversion-driving platform.
FAQs
1. How accurate are Google Analytics heat maps in depicting user behavior?
Google Analytics heat maps are accurate in showcasing trends and user engagement patterns across your website. They visually represent areas of high and low activity, enabling website owners to understand visitor behavior better. However, pairing heat maps with additional analytics tools is recommended for a nuanced understanding of user interactions.
2. Can Google Analytics heat maps track mobile user interactions?
Yes, Google Analytics heat maps effectively track mobile user interactions. These tools are designed to integrate seamlessly with Google Analytics, offering detailed insights into how users navigate and engage with your website on mobile devices. They can help identify which elements capture attention and which may require optimization.
3. What are the main differences between click maps, scroll maps, and move maps?
Click, scroll, and move maps provide valuable insights into user behavior on a website. Click maps show points of interest, scroll maps highlight content retention, and move maps track mouse movements and reading patterns.
4. How often should I analyze my website’s heat map data for optimal results?
Regularly analyzing your website’s heat map data is crucial for improving user experience. After making updates, reviews are especially useful to evaluate user behavior. Tracking heat map data over time helps identify trends and adapt to evolving preferences for enhancing website usability.
5. Are there any privacy concerns associated with using heat maps on my website?
Heat maps collect anonymous, aggregated data to analyze user behavior, focusing on overall patterns rather than individual actions. To maintain transparency and build trust, it’s essential to clearly state their use and data collection methods in your privacy policy.