The best way to compare PPC agencies in Dallas is to look past the monthly fee and examine what each agency does and what its reports prove. A $2,000 agency and a $4,000 agency can manage the same budget very differently. One reports clicks and conversions; the other tracks qualified leads, customers, and revenue.
Pricing only means something once scope is normalized. Reporting tells you whether the money produced business or just activity.
Below are the questions that separate agencies on fees, scope, and reporting transparency. Flying V Group builds PPC reporting around qualified leads and revenue rather than dashboard metrics. Request a sample PPC report to see what that looks like for an account like yours.
Normalize Scope Before Comparing Fees
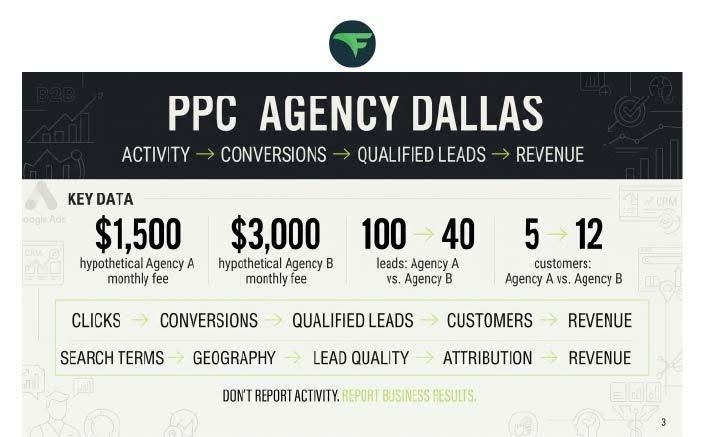
A hypothetical Agency A charges $1,500 a month for campaign management, ad copy, and a basic report. Agency B charges $3,000 for management plus conversion and call tracking, landing page optimization, search-term analysis, offline lead tracking, creative testing, and monthly strategy reviews.
Calling Agency B “twice as expensive” ignores that it delivers a different product. Separate media spend, management fees, setup, landing pages, creative, and software, then compare 12-month totals instead of advertised monthly fees.
Ask How the Fee Changes With Spend
Flat retainers, percentage of spend, tiered fees, and hybrid models each respond differently when an account grows. Ask what happens to the fee if spend rises from $20,000 to $40,000, then ask what additional work comes with that increase. If the fee doubles and the scope doesn’t, the model favors the agency.
Four Levels of PPC Reporting
“We provide transparent reporting” means little until you know how far down the funnel the agency can measure.
| Reporting Level | What It Shows |
| Activity | Clicks, impressions, CTR, CPC |
| Conversions | Forms, calls, bookings, purchases |
| Lead quality | Qualified leads, appointments, opportunities |
| Business outcomes | Customers, revenue, cost per customer, ROAS |
Activity metrics help manage campaigns but say nothing about profit. Ask each agency which level its standard reports reach, and what it needs from your CRM or sales team to go further.
How a Strong Dashboard Can Hide Weak Results
A report showing conversions up 38% and cost per lead down 22% looks excellent until the new conversions turn out to be spam, job applicants, existing customers, or out-of-area inquiries. The agency improved the metric it optimized, not customer acquisition.
| Hypothetical Results | Agency A | Agency B |
| Leads | 100 | 40 |
| Cost per lead | $50 | $100 |
| Qualified leads | 20 | 30 |
| Customers | 5 | 12 |
Agency A wins the standard dashboard. Agency B produces more than twice the customers. Before trusting any cost-per-conversion figure, ask exactly which actions count as conversions.
Separate Branded and Non-Branded Results
If 35 of 50 reported leads came from people searching your company name, the account captured demand that already existed. Someone searching “commercial roofer Dallas” or “HVAC repair Dallas” represents a harder and more valuable acquisition challenge.
Ask whether reports split branded and non-branded performance. Blended totals let cheap branded conversions make the whole account look stronger than it is.
Search Terms and Search Intent
Keywords show what the agency bids on. Search terms show what people typed. A strong agency reports both: productive queries, irrelevant searches, new negative keywords, and emerging demand.
Better reporting groups searches by intent, such as emergency service, pricing, reviews, DIY, and job seekers, then shows which groups produce customers. That turns a keyword list into a decision about where money should go.
Test “Competition” Explanations With Auction Insights
When an agency blames rising costs on competition, ask for evidence. Google’s Auction Insights report compares your impression share, overlap rate, outranking share, and top-of-page rates against advertisers entering the same auctions.
Impression share needs business context. A 35% share is not a problem if the missing auctions are expensive, low-intent, or outside your service area. The question is whether you are missing profitable demand, not whether you appear everywhere.
Report Performance Across DFW
A “Dallas” business may profit most from Plano, Irving, Richardson, Garland, Carrollton, or Frisco, or from only part of the city. Reports should show which areas consumed spend, generated leads, and produced customers.
That is where findings like “Plano leads cost more but close twice as often” or “this area takes 15% of spend and rarely produces a customer” come from. Without geographic reporting, those decisions stay invisible.
Attribution and Assisted Conversions
Buyers with longer research cycles may search a service, then your company’s reviews, then your brand name before converting. Google’s attribution reports show conversion paths and assisted conversions, revealing keywords that helped without receiving the last click.
Ask how the agency reports campaigns that assist rather than close. Judging every campaign by last click can lead an agency to cut the searches that started the customer journey.
What Changed, and Who Changed It
“We optimized your account this month” is not reporting. Ask what changed: budget shifts, new negatives, new ads, bidding adjustments, geographic changes, landing page tests, or restructuring. Then ask why, and what happened afterward.
Automation needs the same scrutiny. Google’s auto-apply settings history shows which recommendation types were switched on, by which user, and how often they applied. If every change is “Google recommended it,” ask what strategic judgment the management fee buys.
Automation Makes Inputs More Important
Smart Bidding and Performance Max still depend on human decisions. Ask which conversions are primary, whether low-quality leads feed bidding, how budgets are allocated, how search themes are monitored, and which decisions remain manual. Our PPC management reports document those decisions every month.
Reporting Quality Over Reporting Frequency
Four automated weekly PDFs are not better than one monthly analysis that explains what changed and what happens next. Compare dashboard access, formal reporting, strategy meetings, and urgent alerts as separate items.
Ask every agency for an anonymized sample report before hiring, and review our work or any agency’s case studies for proof of business outcomes. Look for analysis connecting campaign data to web analytics, lead quality, and revenue, not 25 pages of charts.
Match the Report to Your Business Model
An ecommerce report should cover revenue, ROAS, and new customers. A lead generation report should cover qualified cost per lead, appointment rate, and customer acquisition cost. A B2B report should follow leads into pipeline and closed revenue. No single report format fits every business.
Account Ownership Belongs in the Comparison
Agencies usually manage accounts through Google Ads manager accounts. Google’s ownership rules state that the client account keeps its data and can unlink the manager, but when an agency creates a new account, its manager automatically becomes the owner, with the power to remove users.
Confirm that your company holds admin access, campaign history, conversion setup, audiences, landing pages, and creative. Strong fees and reporting matter little if exit terms leave you starting over.
Red Flags When Comparing Agencies
- No admin access to your own Google Ads account
- Management fees blended with media spend
- Reports that stop at clicks and impressions
- Branded and non-branded results combined
- No search-term or geographic reporting
- Credit for every gain, while declines are blamed on “the market”
- Budget increase requests without evidence of profitable demand
- No anonymized sample report
Choosing the Agency That Reports What Matters
The right Dallas PPC agency defines conversions clearly, separates branded traffic, reports search intent and geography, explains every change, and tracks leads through to customers, all inside an account you own.
Flying V Group builds PPC programs with that level of reporting from the first month. Schedule a reporting review with our team and see how your current reports compare.
Frequently Asked Questions
Should my PPC agency use auto-applied Google recommendations?
Some auto-applied recommendations save time, but each one should be reviewed against your business goals. Google lets advertisers choose which recommendation types apply automatically, so ask your agency which ones are on and why.
What should a monthly PPC report include?
A monthly PPC report should include qualified leads, customers, cost per qualified lead, and cost per customer, alongside spend and conversions. It should also explain what changed, why, and what happens next.
How can I tell whether PPC leads are qualified?
Qualified lead tracking requires feedback from your sales team or CRM about which leads became appointments and customers. Without that data, an agency can only report volume, not quality.
How quickly should offline conversions be uploaded to Google Ads?
Uploading offline conversions within a week keeps them visible across all Google Ads reports. Longer delays can leave gaps in attribution data even when bidding still counts the conversions.
How do I compare two PPC agencies with different pricing models?
Convert both proposals into 12-month totals that include setup, landing pages, tracking, and software. Then compare those totals against the scope and reporting depth each agency provides.
Is a higher PPC management fee worth it?
A higher PPC fee is worth paying when it buys measurable improvements in lead quality, tracking, or conversion rates. Ask for examples of how the agency improved cost per customer, not just cost per click.
What is a good cost per lead for Google Ads in Dallas?
No universal good cost per lead exists, because job value, close rates, and competition differ by industry. Judge cost per lead against cost per customer and the profit each customer brings.